This is a complete list of up-to-date Work Safety Statistics for 2023 and beyond.
In this article, thoroughly research and hand-picked stats covering:
-
- Injuries at workplace
-
- Occupational accidents
-
- Workplace Fatalities
-
- Occupational Safety and Health Administration (OSHA)
-
- Industries at Risk of Workplace Accidents
Injuries at Workplace
Let’s start with the statistics and trends regarding injuries in the workplace. According to NSC injury facts, overexertion, bodily reaction, slips, trips and falls, and contact with object equipment account for more than 75% of all non-fatal injuries at work involving days away from home.
Some other facts about injuries at the workplace include.
-
- About 2.3 million men and women worldwide face work-related accidents every year. (ILO)
According to the International Labor Organization, every year, 2.3 million men and women experience accidents around work, corresponding to over 6000 deaths daily.
-
- In 2021, there were 4,284 fatal work injuries for employees working for wages and salaries, whereas the number of fatal work injuries was 906 for self-employed people. (BLS)
-
- In 2021, the total number of fatal work injuries in the United States was 5,190, with the age group 55 to 64 years accounting for the highest number of injuries and 18 to 19 years with the minimum number of fatal work injuries. (BLS)
-
- Employers report 2.6 million workplace injury and illness cases in 2021, down 1.8% from 2020. (BLS)
-
- The number of preventable work deaths increased by 9% in 2021, totaling 4,472, with 4.26 million work-related medically consulted injuries occurring at the workplace. (NSC Injury Facts)
-
- There were 126 electrical fatalities in 2020, decreasing 24% from 2019 and the lowest number of electrical fatalities recorded since 2003. (Workplace Injury & Fatality Statistics – ESFi)
-
- 565,000 workers sustained non-fatal injuries according to self-reports from the Labour Force Survey in 2021/22, while 61,713 employees faced non-fatal injuries reported by employers in 2021/22 in Britain. (HSE)
-
- In Britain, slips, trips, or falls on the same level were reported as the most common accident kinds in 2021/22 at the workplace, with acts of violence and falls from a height being the least common accident kinds. (HSE)
Occupational Accidents
The next statistics in our list is for occupational accidents, meaning injuries or fatalities associated with occupations. According to the UN Global Compact, nearly 2.78 million workers each year lose their lives due to job-related accidents and illnesses, while an additional 374 million suffer from nonfatal occupational injuries.
Let’s look at some more stats and trends for occupational accidents.
-
- The fatal occupational injury rate in 2021 was 3.6, the highest annual rate since 2016. (BLS)
-
- According to the statistics, employees under 25 years old are more likely to experience work-related injuries requiring emergency medical care than other age groups. (NIOSH)
-
- Transportation incidents were the most frequent type of fatal occupational events in 2021, with 1,982 fatal injuries increasing 11.5% from 2020. (BLS)
-
- It is estimated that the number of fatal job-related incidents in the Commonwealth of Independent States (CIS) countries surpasses 11,000, significantly higher than the officially reported cases of 5,850. (ILO)
-
- In 2021, transportation and material moving employees experienced a record high of 1,523 fatal work-related accidents. (BLS)
-
- The data suggest that fatal job-related accidents vary greatly by region, with the rate being significantly higher in Africa and Asia, at 4 to 5 times that of Europe. (UN Global Impact)
-
- In the Netherlands, the number of nonfatal occupational injuries per 100,000 workers was 5,200, whereas the rate of occupational fatalities per 100,000 workers was 0.5% from 2021-22. (ILO)
-
- A large portion, nearly half (47.4%), of all fatal job-related injuries are among workers in transportation and material moving occupations and construction and extraction occupations. (OSHA)
Workplace Fatalities Statistics
An occupational fatality that occurs when a person is at work or performing work-related tasks. The leading causes of workplace deaths and non-fatal injuries will not always be the same. While transportation incidents were the leading cause of death in 2021, they were the fifth leading cause of non-fatal work injury in 2020.
Here is a summary of the most important workplace fatality statistics and trends.
-
- On a daily basis, approximately 7,500 individuals lose their lives due to inadequate and unhealthy working conditions. The number of deaths resulting from work-related incidents surpasses the annual average of deaths from road accidents, armed conflict, violent crime, and HIV/AIDS combined. (UN Global Impact)
-
- Work-related illnesses are the leading cause of death among employees. Specifically, exposure to hazardous substances alone is responsible for approximately 651,279 fatalities annually. (ILO)
-
- The exposure to dangerous substances or conditions resulted in 798 fatalities among workers in 2021, marking the highest number since 2011. (BLS)
-
- In 2021, there was a 16.3% increase in deaths for drivers/sales workers and truck drivers, which reached 1,031 deaths. (BLS)
-
- Installation, maintenance, and repair occupations had 475 fatalities in 2021, increasing by 20.9%. (BLS)
-
- 80 members of the public were killed due to work-related accidents in 2021/22. (HSE)
-
- Falls from a height were the most common kind of accident, accounting for death in 2021/22, with being trapped by something collapsing/overturning being the least common kind. (HSE)
-
- There were 3,355 fatal accidents at work in the EU during 2020, a decrease of 53 deaths compared to the preceding year. (Eurostat)
The Occupational Safety and Health Administration (OSHA) Statistics
The Occupational Safety and Health Act (OSHA) is a federal agency in the United States that aims to protect workers’ rights by enforcing safety and health standards in the workplace. The agency offers various resources and services to employers, such as training, education, and guidance, to promote safe working conditions for their employees.
Let’s discuss some latest OSHA statistics and trends.
-
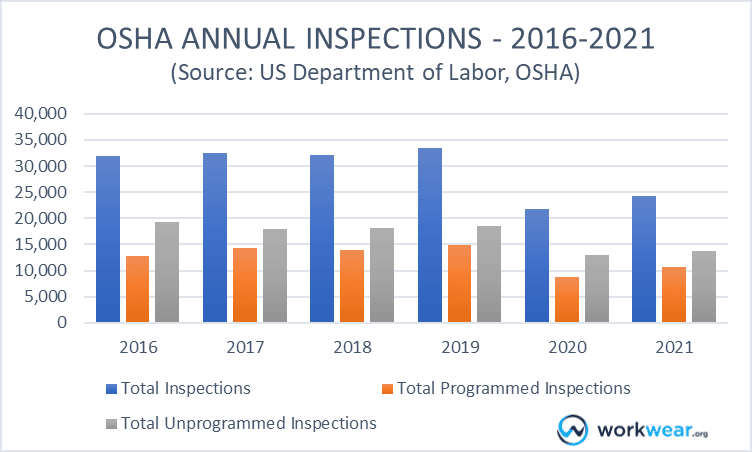
- During the fiscal year 2021, OSHA performed a total of 24,333 inspections, with the majority being unprogrammed inspections, constituting 57% of the total inspections. These unprogrammed inspections include inspections conducted as a result of employee complaints, injuries/fatalities, and referrals. (OSHA)
-
- $591,787,000 was appropriated for the Occupational Safety and Health Administration in 2022 and $591,233,000 for the fiscal year 2021. (OSHA)
-
- In the United States, around 1,850 OSHA inspectors are tasked with ensuring the safety and well-being of 130 million employees at over 8 million workplaces throughout the country. This equates to roughly one inspector for every 70,000 workers. (OSHA)
-
- In 2021, the rate of OSHA recordable cases per 100 full-time workers remained constant at 2.7. (NSC)
-
- By law, many companies that employ more than 10 people are required to document serious work-related injuries and illnesses. (However, some low-risk industries may be exempt from this requirement.) Injuries that only require basic first aid do not have to be recorded. (OSHA)
-
- Companies that have 20 or more employees in certain high-risk industries are required to electronically send Form 300A Annual Summary information to OSHA every year (OSHA)
-
- Companies with 100 or more employees in high-risk industries must provide OSHA with information from Form 300 Log and Form 301 Incident Report annually. These employers are also obligated to submit information from their Form 300A Annual Summary electronically. (OSHA)
-
- The OSHA’s top 10 violations cited most frequently in FY 2021 include the following.
-
- Fall protection, construction
-
- Respiratory protection, general industry,
-
- Ladders, construction,
-
- Hazard communication, general industry
-
- Scaffolding, construction
-
- Fall protection training, construction
-
- Control of hazardous energy (lockout/Tagout), general industry
-
- Eye and face protection, construction
-
- Powered industrial trucks, general industry
-
- Machinery and machine guarding, general industry.
Industries at Risk of Workplace Accidents
Last on our list of work safety statistics and trends in the US and beyond are the industries most at risk of workplace accidents. According to NSC Injury Facts, in 2021, the four industries that can be ranked as the most dangerous were construction, education and health services, agriculture, forestry, fishing and hunting, and transportation and warehousing.
Here are some other stats and trends for the industries at risk of workplace accidents.
-
- In 2021, the rate of total recordable cases in the private sector was 2.7 incidents per 100 full-time equivalent workers. (BLS)
-
- In Britain, the latest data shows that self-reported workplace nonfatal injury rates were significantly higher in these industries: agriculture, forestry and fishing, construction, accommodation and food services, and wholesale/retail trade. (HSE)
-
- In the construction industry, there were almost 78,000 work-related ill health cases, of which 53% were musculoskeletal disorders. (HSE)
-
- There were almost 160,000 work-related ill health cases in the education industry, 59% of which were of stress, depression, or anxiety. (HSE)
-
- OSHA indicates that workers in the healthcare industry are more than 7x more likely to develop musculoskeletal disorders (MSDs) than other workers. (Hardison & Cochran)
-
- According to 2021/22 stats in Britain, around 3.5% of workers in the Waste industry suffer from work-related ill health annually. (HSE)
-
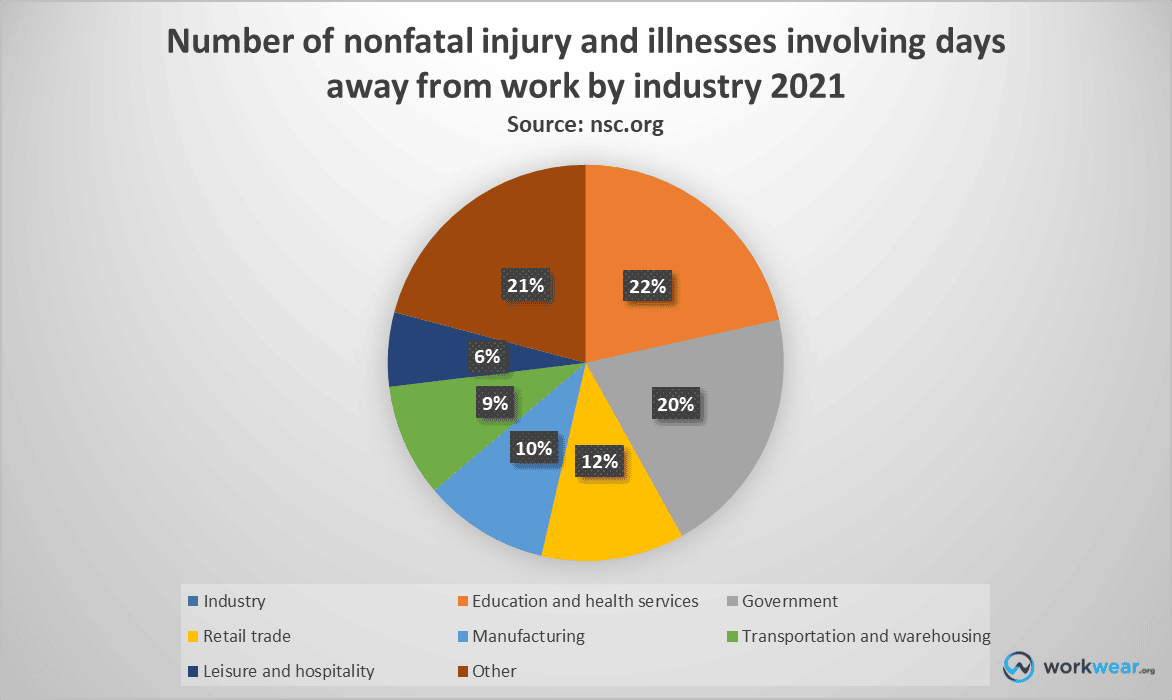
- In 2021, the construction industry had the highest number of workplace fatalities, while the education and health services industry had the highest number of nonfatal injuries and illnesses that resulted in days away from work (NSC)
-
- The number of DJTR cases in the private construction sector increased by 10.4 percent in 2021 to 35,200 cases. (BLS)
It is clear from the stats that care is required at work. No matter which industry you belong to, always make sure you follow the right work-safety measures.
So, this was our ultimate list of work-related safety and accidents. We really enjoyed jotting down this list for you. Let us know which stats you knew earlier and which surprised you the most.
Independent hands-on product testing Products Reviewed Combined Experience Field Testing
Why you can trust us
678+
24+ Years
500+ Hrs
Luke Davis
Luke is the lead author on WorkWear.org. He has a vast experience in construction engineering and project management in California and Texas, where he had the chance to put to test a wide range of safety boots and PPE. Outside work, Luke is an avid hiker and not surprisingly a DIY fanatic!